6/17/2013 Portland, Oregon – Pop in your mints…
Over the past week the M1 money supply has come roaring back from its relative collapse over the prior two weeks. Today, the measure sits at $2.6 trillion.
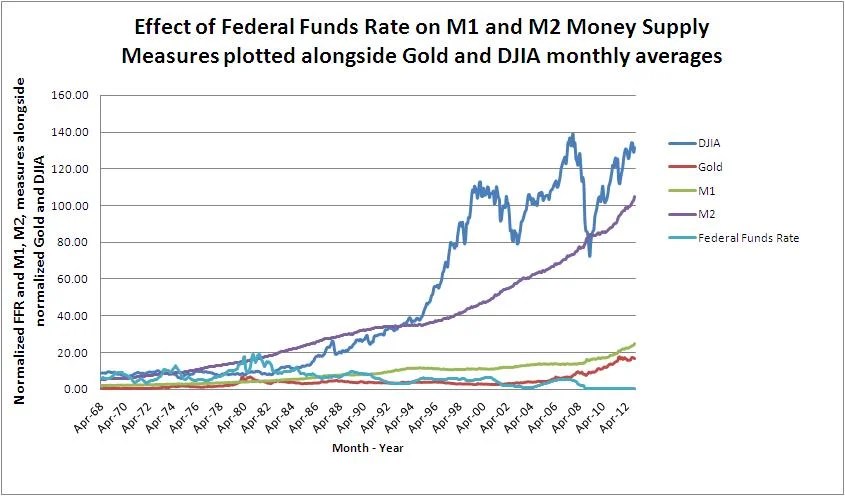
For the uninitiated, the M1 and M2 Money supply measures, published on a weekly basis by the Federal Reserve, are defined as the following:
M1 consists of (1) currency outside the U.S. Treasury, Federal Reserve Banks, and the vaults of depository institutions; (2) traveler’s checks of nonbank issuers; (3) demand deposits at commercial banks (excluding those amounts held by depository institutions, the U.S. government, and foreign banks and official institutions) less cash items in the process of collection and Federal Reserve float; and (4) other checkable deposits (OCDs), consisting of negotiable order of withdrawal (NOW) and automatic transfer service (ATS) accounts at depository institutions, credit union share draft accounts, and demand deposits at thrift institutions. Seasonally adjusted M1 is constructed by summing currency, traveler’s checks, demand deposits, and OCDs, each seasonally adjusted separately.
M2 consists of M1 plus (1) savings deposits (including money market deposit accounts); (2) small-denomination time deposits (time deposits in amounts of less than $100,000), less individual retirement account (IRA) and Keogh balances at depository institutions; and (3) balances in retail money market mutual funds, less IRA and Keogh balances at money market mutual funds. Seasonally adjusted M2 is constructed by summing savings deposits, small-denomination time deposits, and retail money funds, each seasonally adjusted separately, and adding this result to seasonally adjusted M1.
In layman’s terms, the M1 Money supply is what we refer to as “Money on the street,” or cold hard cash. It is the part of the money supply that is otherwise unencumbered or loaned out on float.
The M2 Money supply is perhaps best defined as the Money on the street (M1) plus all of the money that customers think is held at banks but is really loaned out.
In the past, the Federal Reserve also published the M3 (Broad) Money supply measure, which was essentially all of the money that customers had, thought they had, and/or thought that they could receive (via the inclusion of money market funds and repo instruments). It was perhaps the truest measure of the money circulating in an economy in aggregate. In addition to base money, demand deposits, and time deposits, M3 included what the largest treasuries were holding in quasi money instruments . The Federal Reserve stopped publishing the measure on March 23, 2006 as it began to launch into the stratosphere.
While the Broad money supply (M3) may have crossed the line into credit instruments {Editor’s Note: Here at The Mint we recognize all Central Bank notes as credit instruments by definition}, it was an excellent proxy for inflation, for it gave demonstrated the sum total of how many players were participating in the game of monetary musical chairs that the banks and large treasuries play every evening when they settle up.
The M2/M1 Ratio
Today, we submit for your perusal, a graphic of the M2 Money supply divided by the M1 Money supply (the M2/M1 Ratio) by month for the data sets since January 1, 1959, the first year that the data is easily retrievable, through the first week of June.

For purposes of interpretation, the chart shows the degree to which the M1 Money supply is “leveraged” by commercial banks to create what is reported in the M2 figures. Bear in mind this ratio is a function of both bank reserve requirements and consumer behavior. Generally speaking, the M1 and M2 Money supply measures have been increasing over the span of the chart.
The ratio between them, however, has been on a general increase as well, meaning that the M1 measure has been leveraged. This leverage appears to have peaked around 5.4 during the meltdown of late 2008 and early 2009. Ever since then, it has been on a steady decline and currently stands at 4, just a shade above the straight average of 3.7 for the entire data set.
At a glance, it would appear that the economy, in terms of the M2/M1 ratio, is returning to a healthy balance. In practice, this means that the game of musical chairs that occurs at the Fed settlement each night is a bit less stressful for the participants.
Unfortunately, this ratio appears to be historical with little predictive value save that perhaps a ratio of 5/1 being an indication that the monetary base is overextended.
For the moment, with the downward trend in the ratio intact, it appears that the monetary base that the Federal Reserve has gone to great pains to pad via its QE programs, is intact and ready to support an increase in economic activity. Howver, one must keep in the back of their mind that the money supply itself is fragile, and if confidence in the Fed were to evaporate, all bets are off.
Stay tuned and Trust Jesus.
Stay Fresh!
Email: davidminteconomics@gmail.com
Key Indicators for June 17, 2013
Copper Price per Lb: $3.19
Oil Price per Barrel: $97.78
Corn Price per Bushel: $6.68
10 Yr US Treasury Bond: 2.17%
Mt Gox Bitcoin price in US: $106.99
FED Target Rate: 0.09% ON AUTOPILOT, THE FED IS DEAD!
Gold Price Per Ounce: $1,385 THE GOLD RUSH IS ON HOLD FOR THE SUMMER!
MINT Perceived Target Rate*: 0.25%
Unemployment Rate: 7.6%
Inflation Rate (CPI): -0.4%
Dow Jones Industrial Average: 15,180
M1 Monetary Base: $2,634,300,000,000
M2 Monetary Base: $10,586,200,000,000
You must be logged in to post a comment.