
5/3/2013 Portland, Oregon – Pop in your mints…
Today at The Mint we are launching The Mint Money Supply Digest. Longsuffering readers of The Mint will recall that we launched a now defunct service known as the “72 Hour Call” which was an attempt to predict the future direction of a specific trade three days out. After roughly 63 attempts, of which we were batting .524 (correct 52.4% of the time) we decided that the short term call was a fool’s game best left to high frequency traders and those with insider information.
However, the 72 Hour Call exercise was not in vain, rather, what it revealed was that while our Key Indicators (listed below), when taken together, revealed no reliable and/or actionable data with regards to short term trades. Over time, however, the Key Indicators have proven extremely helpful in projecting longer term trends which tend to underpin the S&P 500 in particular and US equity indices in general.
Before we go further, we must give credit to both Lee Adler at the Wall Street Examiner and Greg Guenther of the Daily Reckoning’s Rude Awakening for their brilliant coverage of the frequent gyrations in the financial markets. If you need information which is actionable on a shorter time horizon, we highly recommend following their insights.
The intent of The Mint Money Supply Digest is to provide insight via the observation of changes in the trend of our Key Indicators as to the direction of one simple yet critically important trend.
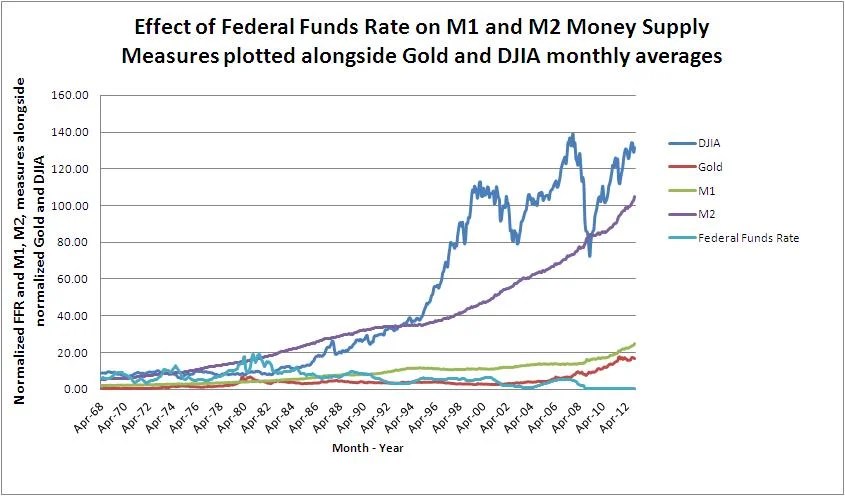
The simple trend is that of the money supply in terms of US dollars. The goal of the monetary stimulus every central bank on the planet has undertaken to some degree or another over the past three to four years has been to simply increase the money supply and hope for the best.
The strategy is a recipe for disaster, as we have explored in depth both here at The Mint and in our eBook series “Why what we use as Money Matters.” The goal of The Mint Money Supply Digest is to keep our readers informed as to the trend of the Money Supply in terms of US dollars in an effort to keep you ahead of the curve when the disasters (for there will be a series of them) occur.
The disasters will come in one of two flavors. The first flavor, which we will call vanilla for the moment, takes the form of the increases in the money supply begin to take hold to the point where inflationary expectations by a majority of the actors in the world economy who use dollars or dollar proxies (currencies and debt instruments which are pegged, directly or indirectly, to the US dollar) in trade become embedded to the point where inflation in consumer prices sparks a level of demand in consumer goods which quickly outstrips supplies of such goods. The vanilla disaster is a mouthful, and it is where the trend is gently heading today.
The second flavor, the disaster which is unlikely in the short term save the appearance of black swan type events, we will call the chocolate variety. The chocolate variety of disaster is simple, it takes the form of an unmitigated collapse in the money supply similar to what the world experienced in 2007 (which most people realized was occurring in 2008). Were this to occur, it is time to get all chips off of the table. Fortunately, our Key Indicators should give us roughly three to four years of advance warning of a full blow chocolate disaster taking place (barring the unpredictable, or black swan event, as it were).
As you can see, while the chocolate disaster is to be feared above all, it will be easier to prepare for given the lead time in the data. The vanilla disaster, which is currently underway to some extent, will be somewhat more difficult to pinpoint in terms of timing but will likely have a lead time of roughly two to three months in which to take action.
Our bias, then, at the outset of The Mint Money Supply Digest, is to be on the lookout for the vanilla disaster while gauging, via the trends in our Key Indicators, just how much chocolate is mixed into the swirl which is the combined disaster that is slowly unfolding in US dollar land.
As a logical offshoot of our analysis, we keep an eye on something we call the “Monetary Premium,” which is our term for what most people simply refer to as money. In our worldview, money does not exist in the tangible way that most people assume it does. Rather, the concept of money comes into being when people begin to attach the attributes of money to something which gives that something (usually one of our Key Indicators) a premium above and beyond what normal market conditions and that special “something’s” physical or ethereal composition might otherwise dictate.
This increase in relative value of that special “something” is what we refer to as the Monetary Premium, and it is important, for a big part of making money is accurately identifying not where the monetary premium is, such as the US dollar, but in where it is gravitating towards, such as gold, Bitcoins, or sea shells.
With the preamble out of the way, we hope to keep the Digests as simple and sweet as a cone on a hot summer’s day.
The Mint Money Supply Digest for May 3, 2013
Today the swirl of disasters continues to tend towards the vanilla variety. Jobless claims continued their positive trend and the unemployment rate reported by the BLS came down a notch to 7.5%. This is good news and bad news. Good news in that more people have jobs, and bad news in that every tick down in Unemployment moves the world closer to the day where the Federal Reserve is likely to turn the switch on their monetary Mega maid, their Quantitative easing programs, from suck to blow. That day is still far off, however.
Today’s jobs report, coupled with the ECB’s dovish meeting announcements yesterday (they are throwing in the towel, albeit in slow motion, on austerity) and the BOJ’s Turbo Kids monetary strategy for an aging population are all buoying the money supply to counteract the unmitigated, innavigable disaster that is the world economy. An economy that is desperately trying to reset itself without the benefit of knowing who is really solvent.
The vanilla disaster is still winning.
Stay tuned and Trust Jesus.
Stay Fresh!
Email: davidminteconomics@gmail.com
Key Indicators for May 3, 2013
Copper Price per Lb: $3.28
Oil Price per Barrel: $95.68
Corn Price per Bushel: $6.99
10 Yr US Treasury Bond: 1.73%
Mt Gox Bitcoin price in US: $91.78
FED Target Rate: 0.14% ON AUTOPILOT, THE FED IS DEAD!
Gold Price Per Ounce: $1,468 THE GOLD RUSH IS STILL ON!
MINT Perceived Target Rate*: 0.25%
Unemployment Rate: 7.5%
Inflation Rate (CPI): -0.2%
Dow Jones Industrial Average: 14,987
M1 Monetary Base: $2,565,500,000,000 LOTS OF DOUGH ON THE STREET!
M2 Monetary Base: $10,571,400,000,000
You must be logged in to post a comment.