5/7/2013 Portland, Oregon – Pop in your mints…
The Dow has briefly touched the 15,000 mark once again and frankly, from a money supply standpoint, it may just be getting started. Ditto for the S&P 500, which is cruising past 1,600 and shows few signs of looking back.
The stock market is front running something. Conventional wisdom, that of seven years ago, would say that it is front running the economy, that a brighter future is on the horizon.
Here at The Mint, we see the stock market as an indicator of the bloat in the money supply and the default primary beneficiary of those who are unloading the monetary premium embedded in the US dollar.
From the dawn of time, up until 1994, the M2 money supply ran ahead of the stock market. Logically, money needed to be created before it could be invested. Then, in 1995, the Glass-Steagall act, which had created a chasm between the commercial and investment flavors of banks since 1933, was effectively repealed as Citicorp and Travelers merged, forcing (or anticipating) the effective repeal of 28 firewalls that Glass-Steagal had set up between the banking sectors.
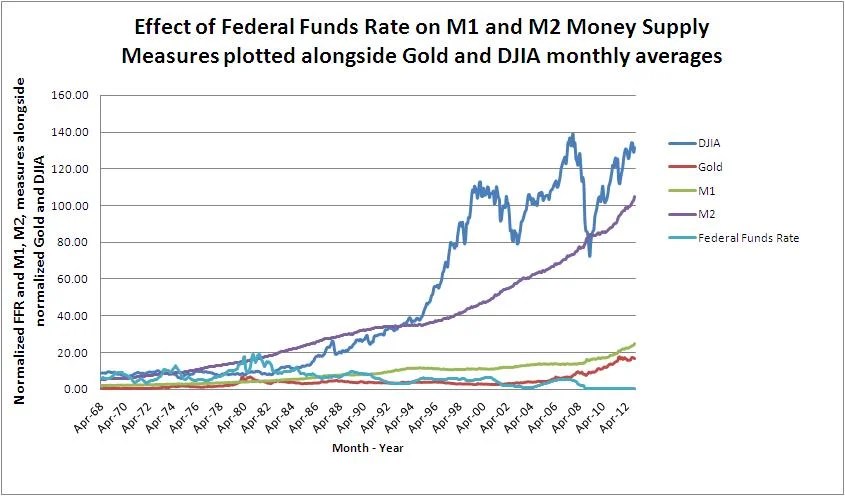
This repeal allowed commercial banks to fund purchases of “Section 20” affiliates, effectively unleashing the credit of the Commercial banking sector into the stock market, and stock indices have front run the M2 money supply ever since (with one notable exception at the height of the 2008 crisis right before the FED threw caution to the wind regarding monetary policy).
The FED will not make the same mistake again. They have embedded expectations that they are willing and able to print money in quantities necessary to avoid another wholesale collapse in the nominal price of financial assets, what we call the chocolate disaster.
However, the FED cannot avoid a collapse in the relative value of financial assets, which is currently underway. While the Dow may be headed to 17,000 before its next scheduled breakdown, the wise among us (that’s you and I, fellow taxpayer), must move our gaze to the diminishing relative value of those 17,000 Dow points.
Take the example of gold. Despite its recent collapse in price, gold, which may have yet another leg down, has shown itself to be incredibly resilient in the face of insurmountable odds, for the same credit mechanism that is used to shamelessly juice the stock market is also used to shamelessly short precious metals.
What is surprising, then, should not be that gold has collapsed some $350 in recent months, but that it has bounced back at all against a financial enemy with an unlimited supply of ammunition.
The physical supply of gold is another story. As anyone who has attempted to source gold or silver at these rock bottom prices can attest, it has been difficult to say the least, and it will be mid summer before supplies recover from the recent price shock.
Another non productive asset that is gaining on the Dow in relative terms is the Bitcoin. While the digital currency continues to be too volatile to trade, it is still attractive anywhere under $80. While not the panacea that many believe it to be, the Bitcoin fulfills a human need that will not soon go away.
Finally, corn, which took a similar early April bath along with a number of commodities, is raging back as well.
It will be an interesting summer indeed as the vanilla disaster continues to pile up. Soon, owning real assets will be not simply a luxury, but a necessity, as gains in the stock indices are dwarfed by real inflationary pressures.
Stay tuned and Trust Jesus.
Stay Fresh!
Email: davidminteconomics@gmail.com
Key Indicators for May 7, 2013
Copper Price per Lb: $3.26
Oil Price per Barrel: $95.80
Corn Price per Bushel: $6.79
10 Yr US Treasury Bond: 1.79%
Mt Gox Bitcoin price in US: $105.20
FED Target Rate: 0.15% ON AUTOPILOT, THE FED IS DEAD!
Gold Price Per Ounce: $1,449 THE GOLD RUSH IS STILL ON!
MINT Perceived Target Rate*: 0.25%
Unemployment Rate: 7.5%
Inflation Rate (CPI): -0.2%
Dow Jones Industrial Average: 15,012
M1 Monetary Base: $2,565,500,000,000 LOTS OF DOUGH ON THE STREET!
M2 Monetary Base: $10,571,400,000,000
You must be logged in to post a comment.